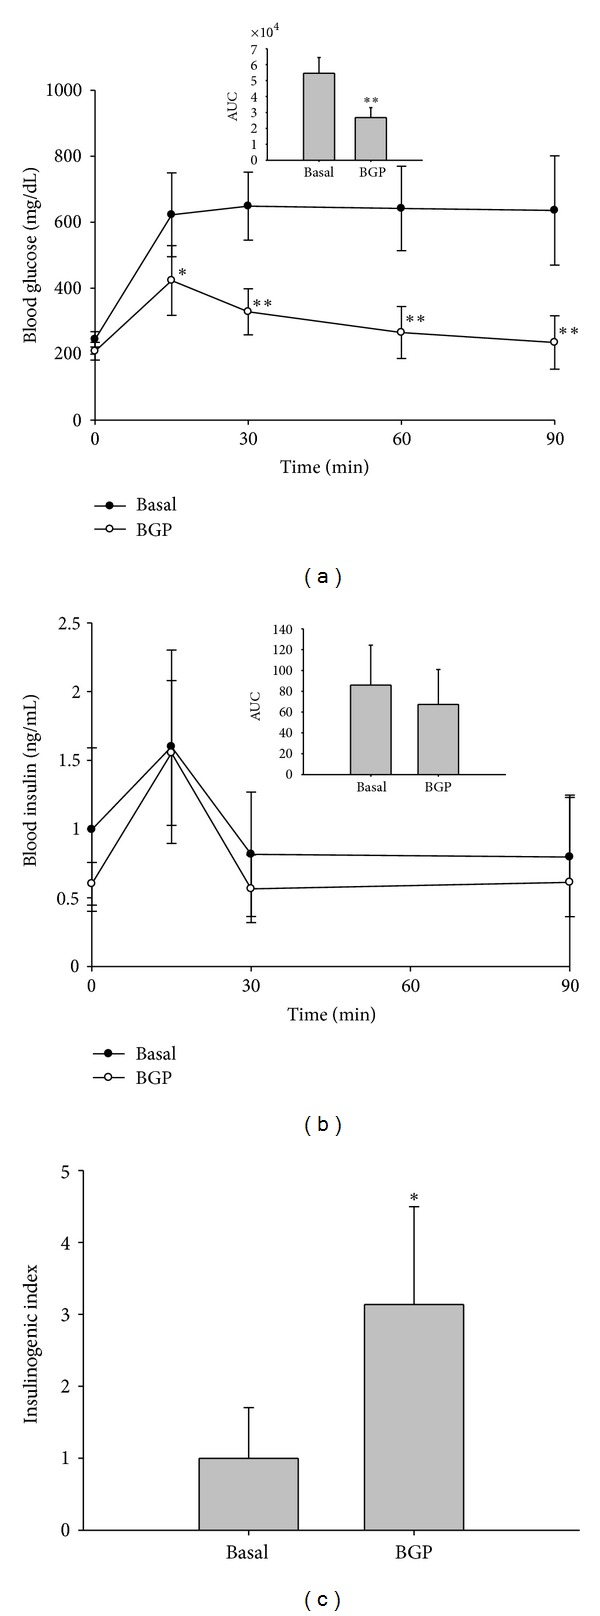
Figure 1.

Oral glucose tolerance and insulinogenic index of mice fed the BGP diet for 5 weeks. (a) Serum glucose and area under curve (AUC), (b) serum insulin and area under curve (AUC), and (c) insulinogenic index in an oral glucose tolerance test (OGTT). C57BL/6J male mice were fed a basal or a 5% BGP diet for 5 weeks. For OGTT, mice were feed deprived overnight and orally fed a glucose solution at the dose of 2 g/kg body weight. Insulinogenic index was calculated as the ratio of Δ serum insulin (15 min–0 min)/Δ serum glucose (15 min–0 min), and that of the basal group was taken as 1. Data are mean ± SD. *P < 0.05 and **P < 0.01 denote significant difference compared to the basal group analyzed by Student's t test.
