
Figure 2.
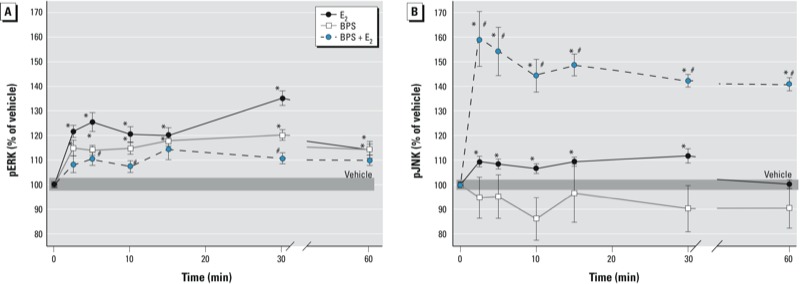
BPS (10–14 M) disruption of E2-induced (10–9 M) time-dependent phosphorylations of ERK (A) and JNK (B) in GH3/B6/F10 cells. The pNp signal for phosphorylated MAPKs normalized to the CV value for cell number is expressed as a percentage of vehicle-treated controls. Mean absolute absorbance values (normalized to cell number estimates) of the vehicle control are 0.685 for ERK and 0.395 for JNK. The width of the shaded area represents the means ± SEs of vehicle-treated cells; n = 24 over three experiments. *p < 0.05 compared with vehicle. #p < 0.05 compared with 10–9 M E2.