
Figure 6.
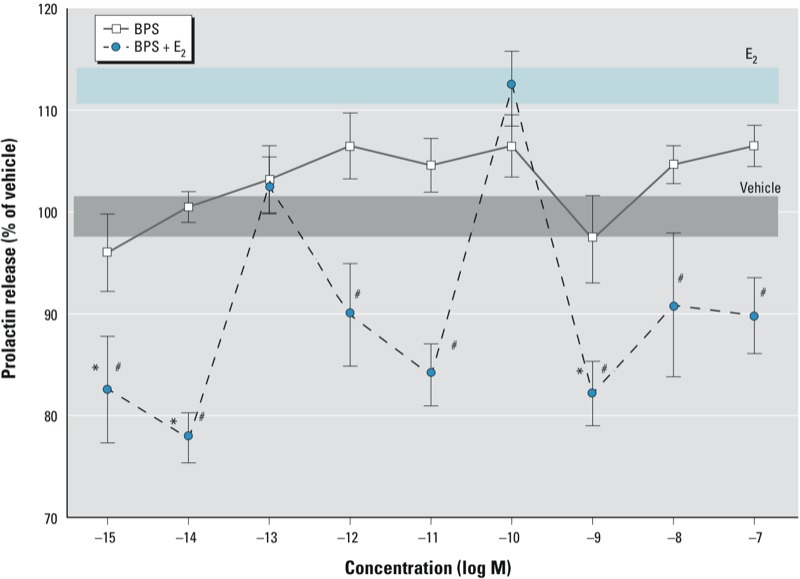
Effect of BPS on E2-induced PRL secretion in GH3/B6/F10 cells. The amount of PRL secreted for each well (counts per minute) was normalized to the CV value for cell number, and expressed as a percentage of vehicle-treated controls. The absolute value (normalized to cell number estimates) of the vehicle control is 466. The width of shaded areas represents means ± SEs for vehicle (gray) and E2 (blue). Values shown are means ± SEs; n = 24 over three experiments. *p < 0.05 compared with vehicle. #p < 0.05 compared with 10–9 M E2.