
Figure 2.
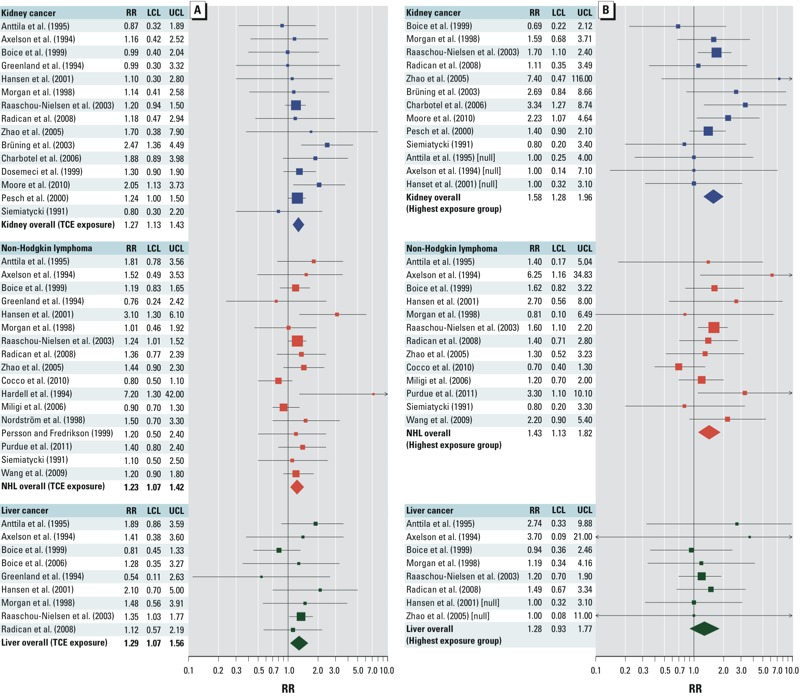
Forest plots from random-effects models of overall (i.e., “ever” or “any”) TCE exposure (A) and highest TCE exposure groups (B), adapted from Scott and Jinot (2011). Individual study RR (squares) and RRm (diamonds) values are plotted with 95% CIs (LCL, lower confidence limit; UCL, upper confidence limit) for each cancer type. Symbol sizes reflect relative weight of the studies.