Figure 1.
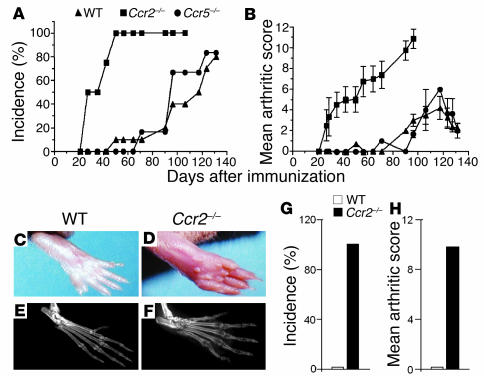
CIA incidence and severity is increased in Ccr2–/– mice. The data shown in this figure are representative of one of a minimum of three experiments. (A–F) In the experiment shown, Ccr2–/– mice (n = 8), Ccr5–/– mice (n = 6), and WT mice (n = 10) were given primary and booster injections of bovine CII and monitored two to three times per week for incidence and severity of arthritis. All mice were backcrossed six generations into the DBA/1J background. Days after immunization in A and B represent days after the second immunization with CII. (A) The cumulative number of arthritic animals in each group is shown as a percentage of the total number immunized with CII. (B) Arthritic score for each group at each time point was divided by the number of arthritic mice to calculate a mean severity score (± SEM). The maximal arthritic score for Ccr2–/– mice (11.0 ± 0.8) was significantly higher than the scores for WT (3.9 ± 0.7) and Ccr5–/– mice (3.2 ± 1.2) (P < 0.0001). The difference between WT and Ccr5–/– mice was not significant (P = 0.5). Photomicrographs (C and D) and radiographs (E and F) from WT and Ccr2–/– mice depicting severe arthritis and bone destruction and erosion in Ccr2–/– mice. (G) Incidence and (H) severity of arthritis determined 2 weeks after immunization with CII in F8 backcrossed Ccr2–/– (n = 3–4 mice per experiment) and WT mice (n = 3–4 mice per experiment).

