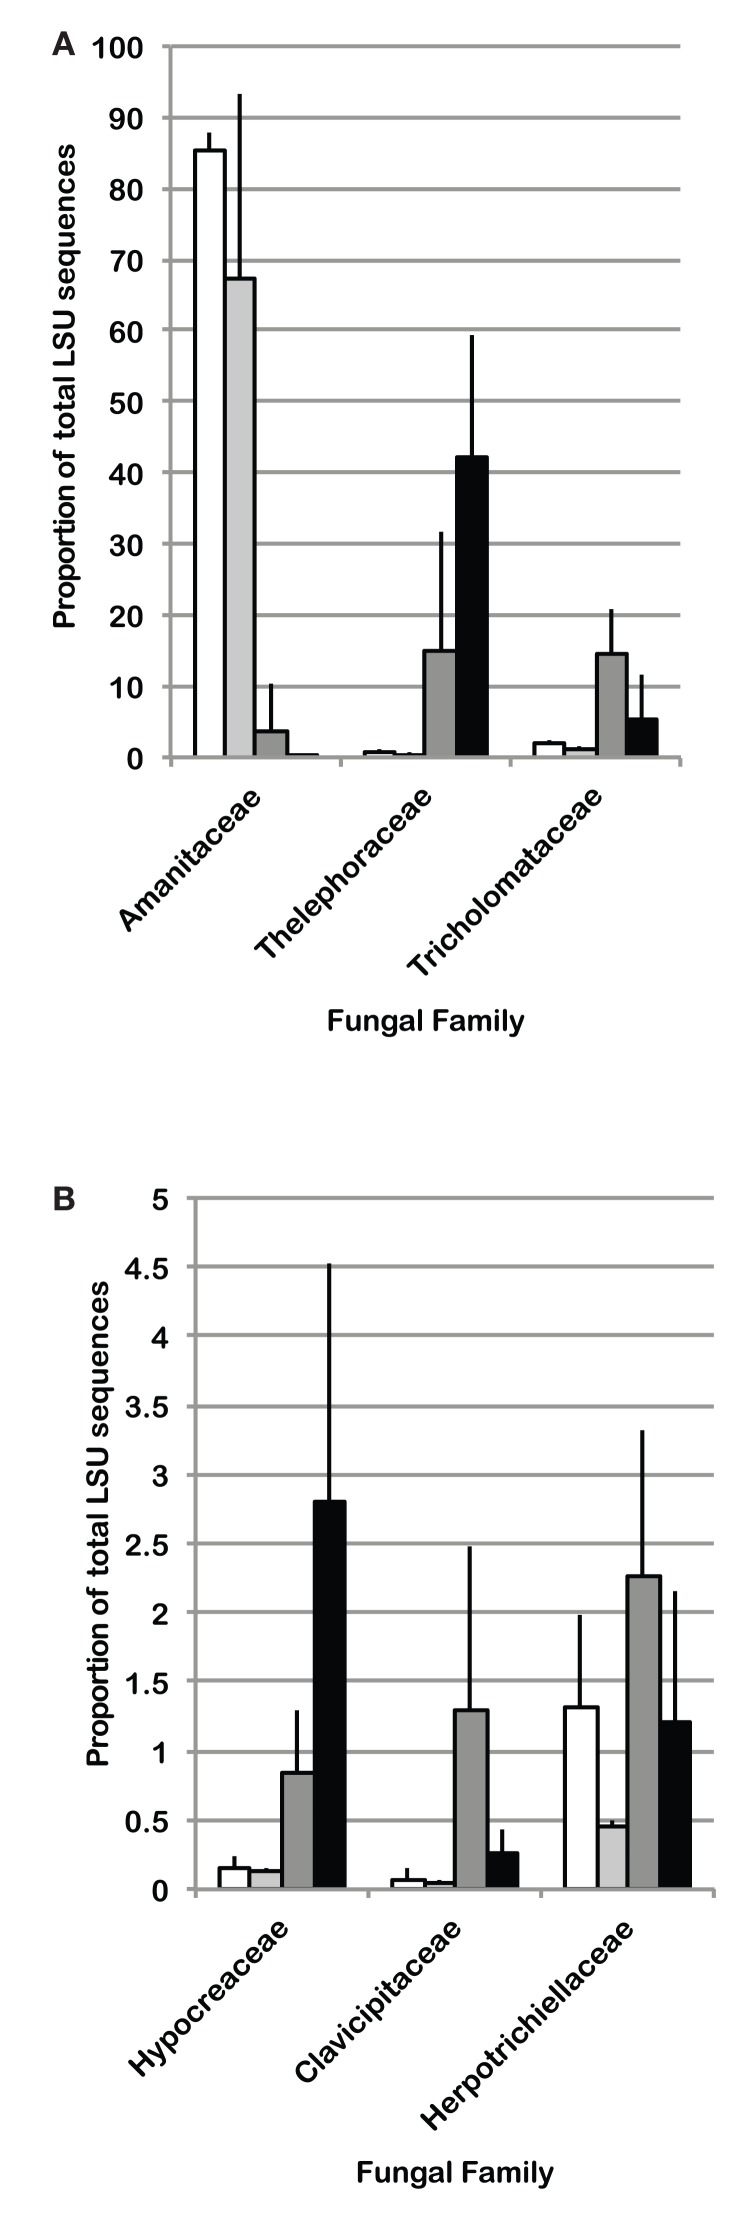
Figure 4.
Average percent of sequences in LSU 454 pyrotag libraries classified as (A) Basidiomycota or (B) Ascomycota, for which statistically significant differences (ANOVA p < 0.10 using a factorial model) were identified among field treatments in the 0–2 cm depth interval (n = 3). White bars: aCO2, light gray bars: eCO2, dark gray bars: N-fertilization, black bars: eCO2 + N-fertilization.

