
FIG. 2.
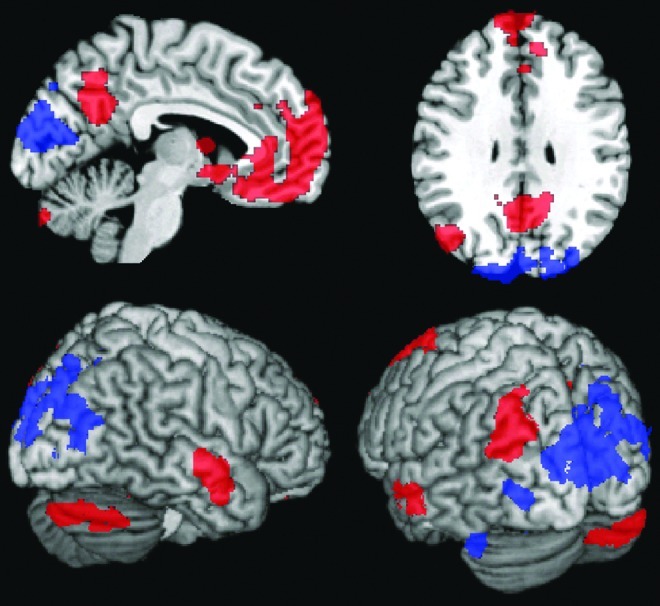
Maps of the anatomical locations of the significant positive (red) and negative (blue) correlations with posterior alpha power. All the regions, except for the cluster in the cerebellum (p=0.07, corrected) shown here are significant after cluster-level correction for multiple comparisons (p<0.05), after passing an uncorrected threshold of p=0.01.