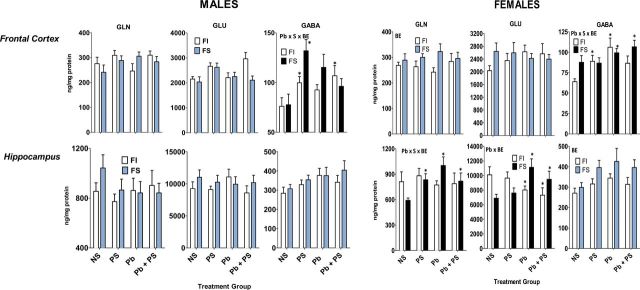
FIG. 6.
Group mean ± SE amino acid neurotransmitters (ng/mg/protein) levels in male (left panel) and female (right panel) offspring of indicated brain regions.
NS: 0-NS, no Pb, no stress; PS: prenatal stress, no Pb exposure; Pb: Pb exposure, no prenatal stress; Pb + PS: Pb exposure and prenatal stress. *Significant difference of at least p ≤ 0.05 from corresponding 0-NS control group value following initial ANOVA (Table 3). Plots with black FS bars indicate significant interactions of Pb, PS, or both with BE in the overall ANOVA.

