FIG. 8.
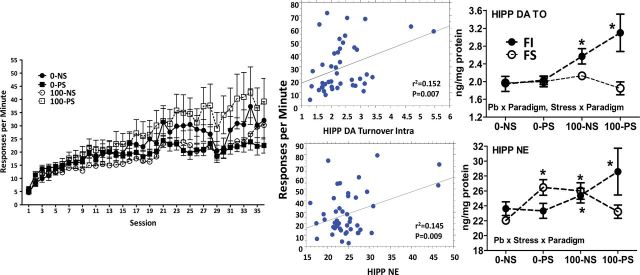
Left: Group mean ± SE response rates on the FI schedule of food reward across sessions in male offspring (n = 10–16 per group). Middle: Scatter plot from linear regression of response rates against hippocampal DA turnover (DOPAC/DA; top) and hippocampal NE (bottom). Right: Levels (ng/mg protein) of hippocampal DA turnover (top; n = 8–16 per group) and hippocampal NE (bottom; n = 8–17 per group) by treatment group (NS: 0-NS, no Pb, no stress; PS: prenatal stress, no Pb exposure; Pb: Pb exposure, no prenatal stress; Pb + PS: Pb exposure and prenatal stress) and behavioral paradigm (FI: fixed interval schedule of reward BE; FS: forced swim BE).
*Significant difference of at least p ≤ 0.05 from corresponding 0-NS control group value.

