
FIG. 2.
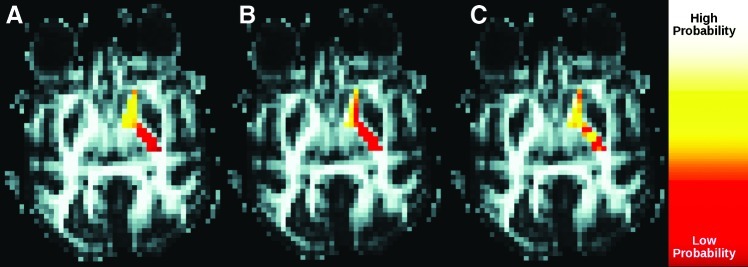
Overall impact of Morris correction on profile of connections from caudate through the IC. (A) shows the null distribution map. (B) and (C) show connection profiles before and after the correction, respectively.
Official websites use .gov
A
.gov website belongs to an official
government organization in the United States.
Secure .gov websites use HTTPS
A lock (
) or https:// means you've safely
connected to the .gov website. Share sensitive
information only on official, secure websites.
Overall impact of Morris correction on profile of connections from caudate through the IC. (A) shows the null distribution map. (B) and (C) show connection profiles before and after the correction, respectively.