
FIG. 5.
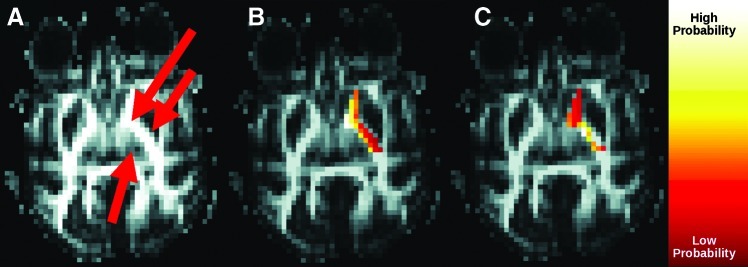
Effect of Morris correction on connectivity between the IC and thalamus. (A) Fractional anisotropy image indicating location of the thalamus (single arrow) and IC (double arrow). Connectivity (B) without and (C) with correction.
Official websites use .gov
A
.gov website belongs to an official
government organization in the United States.
Secure .gov websites use HTTPS
A lock (
) or https:// means you've safely
connected to the .gov website. Share sensitive
information only on official, secure websites.
Effect of Morris correction on connectivity between the IC and thalamus. (A) Fractional anisotropy image indicating location of the thalamus (single arrow) and IC (double arrow). Connectivity (B) without and (C) with correction.