
FIG. 7.
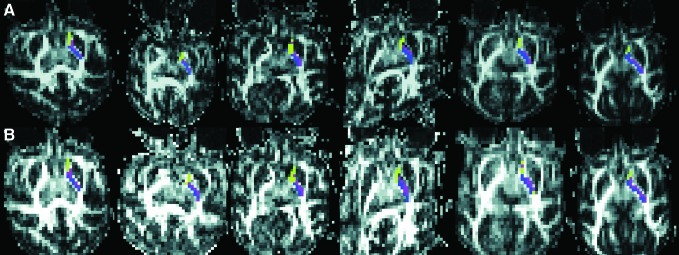
Impact of correction on hard segmentation across the six studies. Of the three target structures green regions had the highest probability of connection to caudate, and purple and blue to LN and thalamus, respectively. The top row (A) shows segmentation before the correction, and the bottom row (B) after correction. Many voxels in the IC change classification because of the correction, and although patterns seem similar in the top and bottom row, it is not clear how the Morris correction impacted results.