Figure 8.

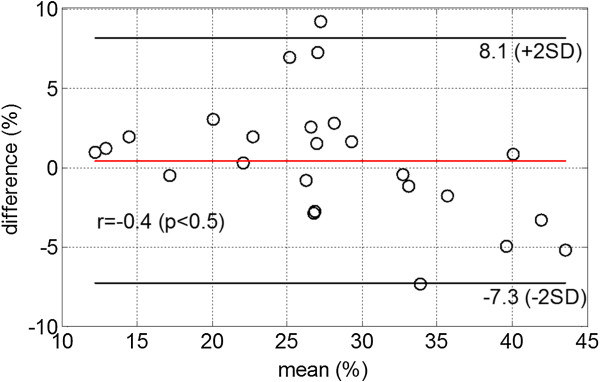
Bland-Altman plot of oedema extent between manual results and the automatic approach, the difference is defined as auto – manual.

Bland-Altman plot of oedema extent between manual results and the automatic approach, the difference is defined as auto – manual.