
Figure 14.
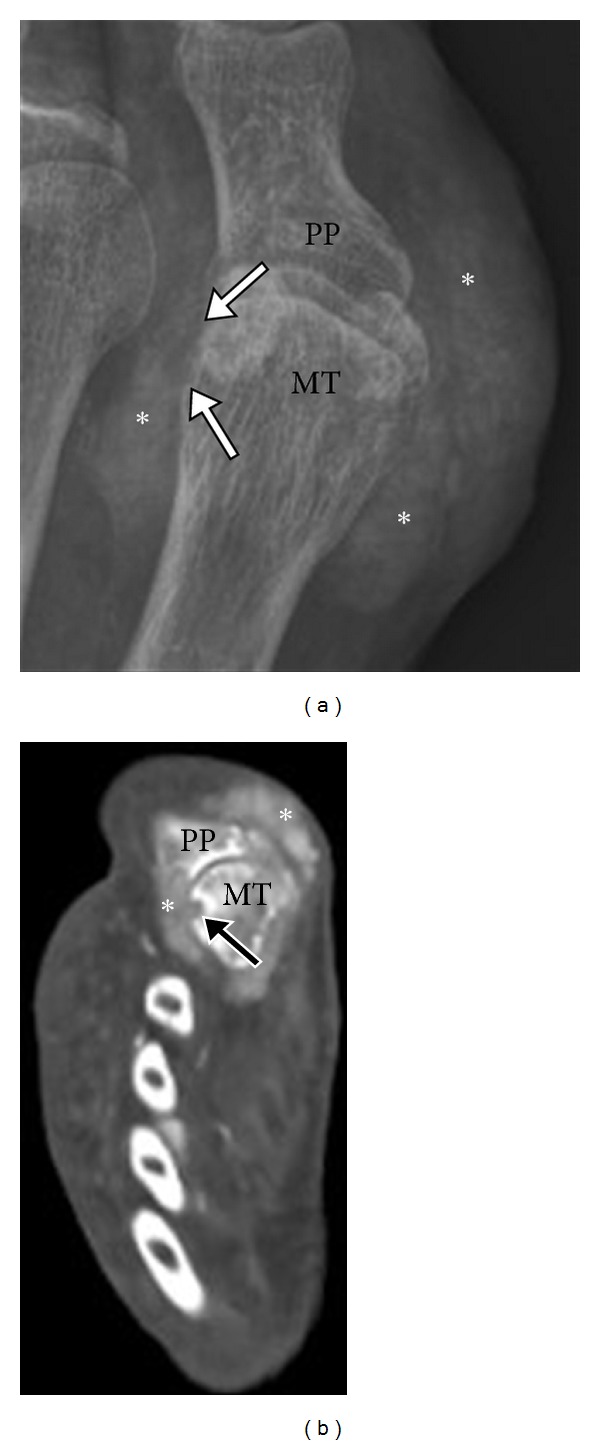
Tophaceous gout on CT. Anteroposterior radiograph (a) of the 1st MTP joint demonstrates dense soft tissue masses (*) centered on the 1st MTP with erosive changes involving the lateral aspect of the 1st MT head (arrows). Corresponding axial CT image (b) shows periarticular high attenuation soft tissue deposit adjacent to the first MTP joint (*) with focal cortical erosion (arrow). MT: metatarsal head; PP: proximal phalanx.