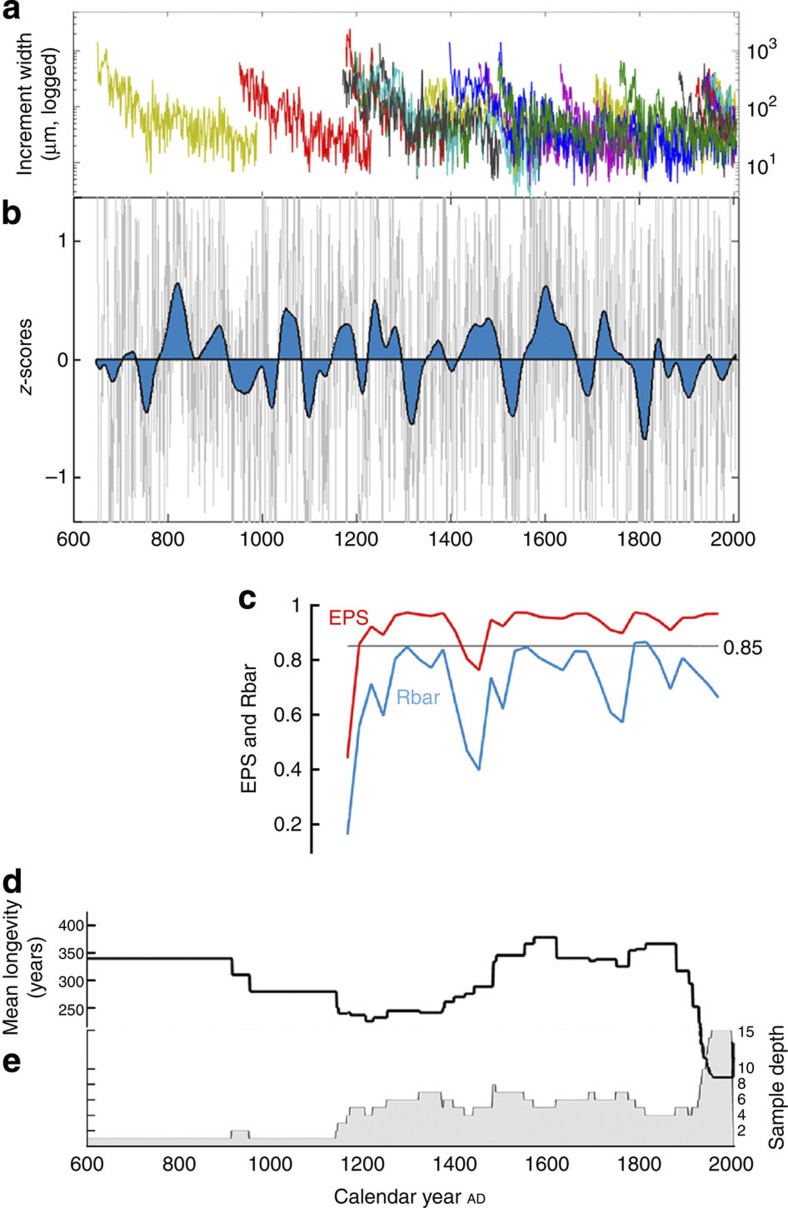
Figure 2. Master shell chronology from the North Icelandic shelf and chronology statistics.
(a) Raw increment widths (logged) for each of the 29 shells used in the master shell chronology. (b) Detrended growth increments normalized as z-scores ((value−mean)/standard deviation) derived from the autoregressive modelled chronology with a 70-year low pass centrally weighted Gaussian filter; see ref. 27 for additional details. (c) Expressed population signal (EPS; red) with the 0.85 critical value noted, and the mean correlation between all detrended series (Rbar; blue). (d) Mean longevity of all shells in the chronology at that point. (e) Sample depth of chronology at that point.

