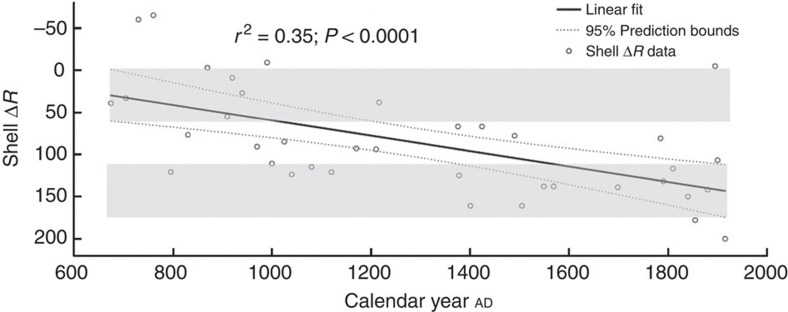
Figure 8. Millennial-scale trend in shell ΔR values.
Linear fit and regression statistics of the shell ΔR data (AD 675 to AD 1915) are shown. The data were modelled (solid black line) using MatLab (version R2010A; Curve Fitting Toolbox) to establish the uncertainty in modelled shell ΔR data. The 95% (confidence interval) prediction bounds (dashed lines) of the model are shown, and these results illustrate that the prediction bounds do not overlap between the early and late parts of the record (highlighted rectangles).

