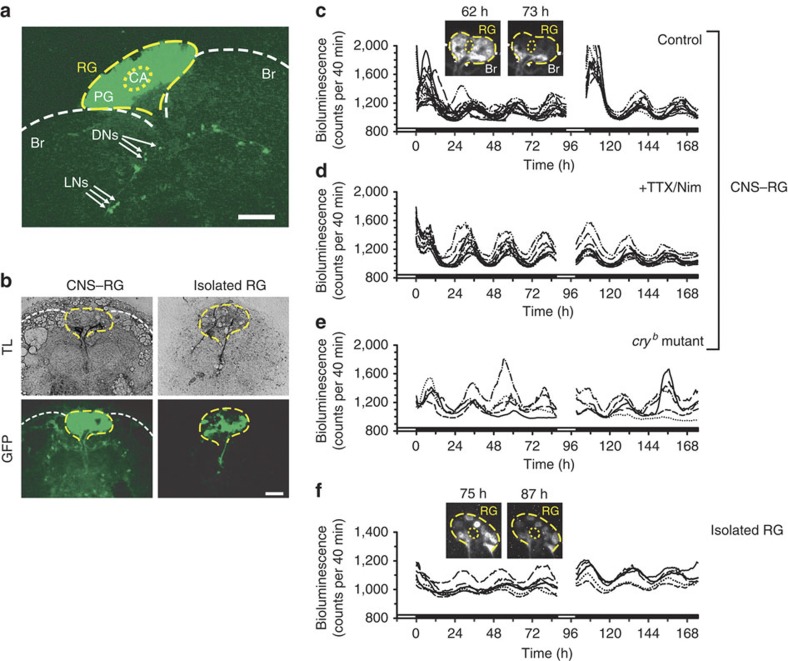
Figure 1. Visualization of per-transcriptional rhythms in single PG cells in vitro.
(a) GFP expressed in a CNS–RG complex culture from a per-luc/tim-gal4; UAS-GFPII S65T/+ fly after 12 h in vitro. GFP fluorescence was concentrated between brain hemispheres (Br; white dashed lines) in the RG (yellow dashed line), which contains the PG and CA (yellow dotted line). Arrows indicate GFP-positive LNs and dorsal neurons (DNs). Scale bar, 100 μm. (b) GFP-positive cells in a CNS–RG complex culture (left) and an isolated RG (right) after 10 days in vitro. Transmitted light (TL) images show connective tissue spread laterally from the isolated RG, but containing no GFP-positive LNs or DNs. Scale bar, 100 μm. (c) Per transcript signal intensity changes in single PG cells in the CNS–RG complex. Different line types (for example, dashed with two dots) indicate data from a single cell. Oscillations were of high amplitude at the beginning of recordings, which rapidly reduced under DD. Data from four different cultures were superimposed. One organotypic culture re-exposed to 12 h of light (120 lux) exhibited a similar transition at the beginning of recording. (d) A similar experiment, but CNS–RG complexes were cultured in medium containing TTX (0.3 μM) and nimodipine (Nim; 2 μM). The light-to-dark transition response was blocked. (e) A similar experiment, but CNS–RG complexes were cultured from cryb mutants. The light-to-dark transition response was blocked. (f) Per transcript signal intensity changes in single PG cells in isolated RG cultures of wild-type flies. Steady low-amplitude circadian oscillations were observed with no light-to-dark transition. Smaller absolute per transcript signal in isolated RGs compared with CNS–RG complexes. All the above bioluminescence measurements were conducted in culture medium containing 1 mM luciferin, without any medium exchange during the entire recording period. White and black bars on the bottom indicate light and dark periods, respectively. Images in (c) and (f) indicate example bioluminescence images collected at the circadian peak and trough. The corresponding GFP images at the end of the experiments are shown in (b).

