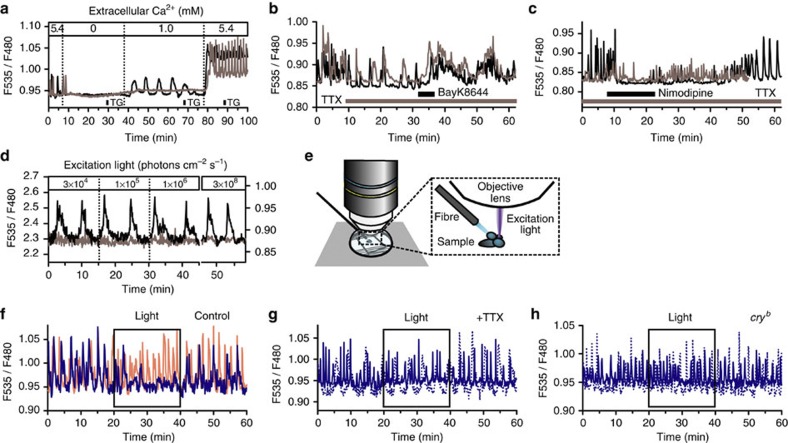
Figure 6. Calcium dynamics in PG cells.
The CNS–RG complexes (a–c and f–h) and isolated RG (d) were cultured from tim-gal4/UAS-cameleon (YC2.1-82) flies. Representative data from two different cells were plotted for each experiment. (a) The frequency of spontaneous Ca2+ spikes depended on the extracellular Ca2+ concentrations. In contrast, exposure to the Ca2+-ATPase inhibitor thapsigargin (TG; 1 min, 1 μM) had no effect on the frequency of Ca2+ spikes. (b) Effects of TTX (0.3 μM) and the L-type Ca2+ channel activator BayK8644 (100 μM) on Ca2+ spikes in PG cells. TTX reduced the frequency but did not abolish Ca2+ spikes. Exposure to BayK8644 increased the Ca2+ spiking frequency again, even in the presence of TTX. (c) PG cells in CNS–RG complexes cultured in medium containing TTX exhibited Ca2+ spikes similar to control culture conditions. Nimodipine (2 μM) reduced the Ca2+ spiking frequency in PG cells cultured with TTX. (d) The effect of excitation light on [Ca2+]c was tested in PG cells in isolated RG cultures using an LED light source. The low-fluorescent signals were amplified using an EM–CCD gain. The relatively noisy traces at 3×10⁴ photons cm−2 s−1 (invisible to eye) were caused by the electrical amplification of the signals. Neither the frequency of Ca2+ spikes nor baseline [Ca2+]c levels were affected by excitation light in PG cells in isolated RG cultures. (e) To examine the effects of photic stimulation on Ca2+ spikes (f–h), a micro-light was located near the brain hemisphere. An excitation light for Ca2+ imaging (435–445 nm) was tightly focussed on the RG. (f) Exposure of the brain to blue (455–505 nm; blue trace) but not red (595–645 nm; red trace) light temporarily blocked Ca2+ spikes in PG cells in CNS–RG complex cultures. The effects of blue light exposure (in two representative cells as solid and dashed lines) were abolished in PG cells cultured with TTX (g) or in PG cells cultured from cryb background flies (h). All the above results were consistently observed in 44–119 cells in 3–5 organs.

