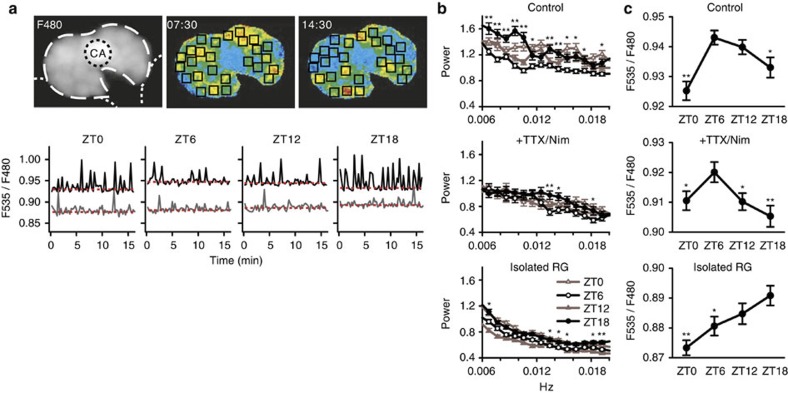
Figure 7. Day–night variations in Ca2+ spiking profiles in PG cells.
(a) Upper left panel: An example fluorescence image (F480 nm) of a CNS–RG complex cultured from a tim-gal4/UAS-cameleon (YC2.1-82) fly. The RG is indicated by the white dashed line, the CA by the black dotted line, and the CNS by the white dotted lines. Upper centre and right panels: Two virtual-colour images at different time points indicating [Ca2+]c based on the fluorescence ratio (F535/F480 nm). Warmer colours indicate higher [Ca2+]c. Squares in the virtual-colour images indicate the approximate locations of PG cells, which exhibited Ca2+ spiking with periods of ~1–3 min (0.006–0.017 Hz). The CNS in this field exhibited no fluorescence and CA cells exhibited little or no [Ca2+]c oscillations. Lower panel: typical [Ca2+]c oscillations in PG cells at 4 different ZTs. Each trace indicates the [Ca2+]c in a single PG cell in either CNS–RG complex (black) or isolated RG (grey) culture. The estimated baseline levels are indicated by red dotted lines. The frequency of spontaneous Ca2+ spikes depended on the ZT, which was highest in the middle of the night (ZT18) in PG cells in the CNS–RG complex. (b) The Ca2+ spiking frequencies in PG cells were determined using FFT analysis. In untreated CNS–RG complexes, the wide-band frequency power was higher at ZT18 than at ZT6. The overall frequency power and day–night differences were diminished in CNS–RG complexes cultured with TTX and nimodipine (+TTX/Nim) and in isolated RG cultures. *P<0.05, **P<0.01 significantly larger than the corresponding ZT6 groups, repeated one-way ANOVA followed by a Duncan's multiple range test. (c) The baseline [Ca2+]c levels in PG cells exhibited day–night variations. The highest baseline values were found at ZT6 in untreated CNS–RG complex cultures (control) and CNS–RG complexes cultured with TTX/Nim. The peak baseline value was shifted to ZT18 in isolated RG cultures. *P<0.05, **P<0.01, one-way ANOVA followed by a Duncan's multiple range test.

