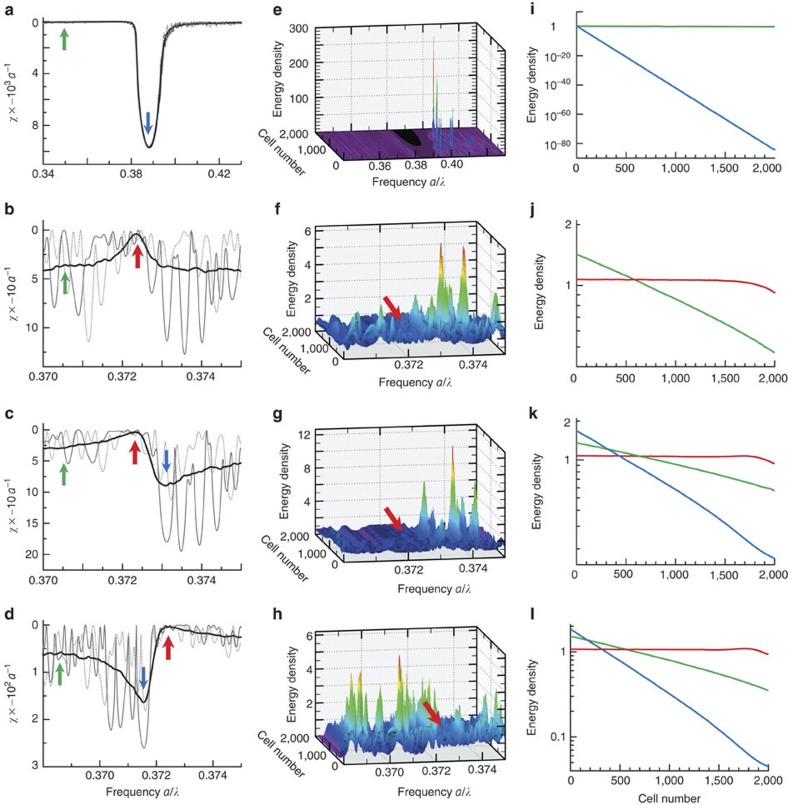
Figure 4. De-localization of light at Bragg wavelength in 1D photonic crystals with ɛ-disorder.
(a–d) Averaged extinction spectra χ(λ) (thick curves) and extinction spectra for two realizations (thin curves) in the proximity of second order Bragg band. Arrow shows three regions: Fabry–Perot background (green), Bragg dip (blue) and Bragg peak (red). (e–h) Electromagnetic energy density distribution. Amplitude of fields normalized to the incident wave amplitude. (i–l) Averaged energy density logarithm distribution for the three spectral regions. Parameters of 1D PhC were  , N=2,000, M=500.
  , ɛA=1.800,
  (a,e,i), 1.805 (b,f,j), 1.800 (c,g,k), 1.815 (d,h,i).

