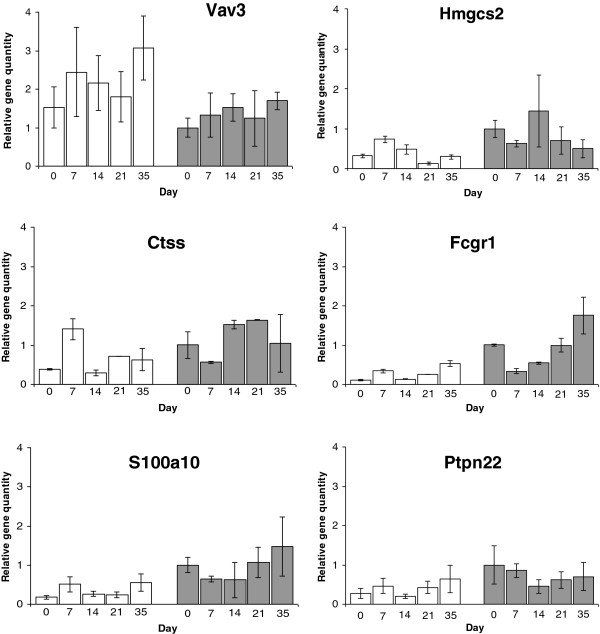
Figure 4.
Colonic Tm3 gene expression by independent qPCR. Results are displayed relative to naïve resistant BALB/c, following standardization and normalization of samples against housekeeper gene (β-actin). Shown are the top 3 candidates by pathway & SNP analysis (Table 1: Vav3, Hmgcs2 & CTSS), the current strongest candidate gene from the literature (Fcgr1), the candidate with the highest text mining score but no designated biological pathway (Table 3: S100a10) and the candidate with the most SNPs but as yet without a designated pathway (Table 3: Ptpn22). Open bars denote susceptible AKR, shaded bars denote resistant BALB/c.

