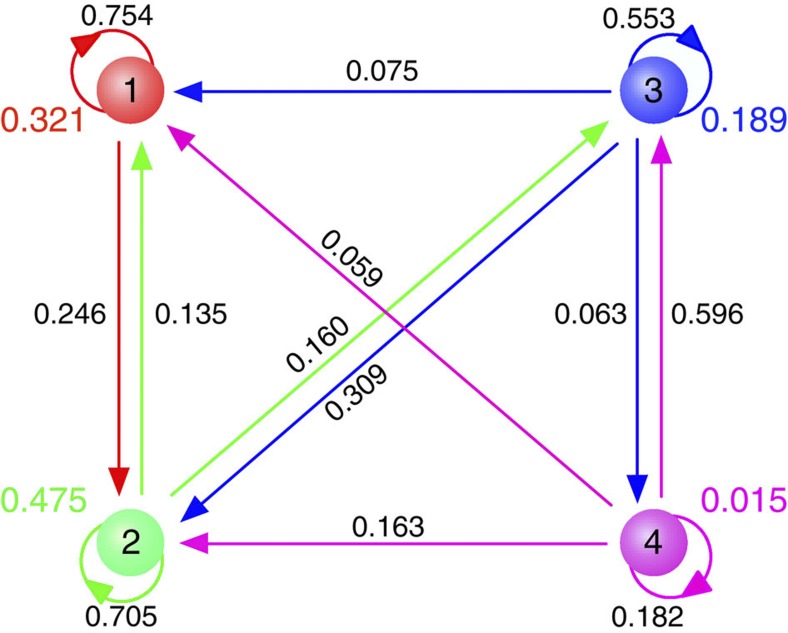
Figure 4. Transition probabilities between different levels of diversity.
The consequences of mutations for the diversity are described by transition probabilities for low mutation rates under strong selection. The transition probability between different levels of diversity results from the appearance of a mutant. Each circle marks a certain number of coexisting types and the probability that the population is in this state (cf. to Fig. 3b), arrows mark the probabilities of the transitions between these states after the appearance of a mutant. A mutation can only increase the diversity by at most one type, but this probability decays rapidly with the number of coexisting types. A new mutation can also lead to a decrease in the diversity to any level. Here we show the transitions for up to four coexisting types under strong selection; as illustrated in Fig. 3b, the probability to be in states with n>4 under strong selection is negligible for the present parameter combination. (population size N=1,000, mutation rate μ=10−6 per time step, selection intensity w=10, averages obtained over 500 independent realizations and 107 generations per realization after a transient period of 25,000 generations. All simulations start from a monomorphic state).

