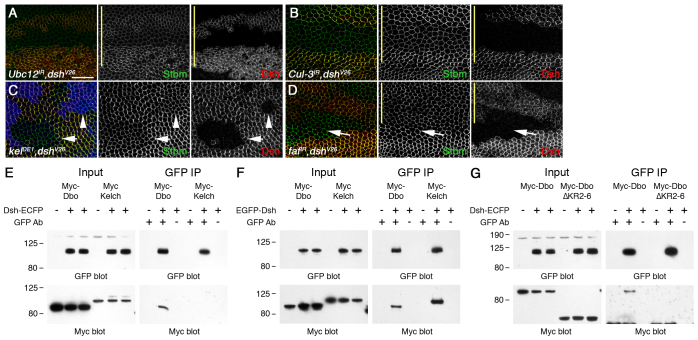
Fig. 4.
Dsh is the target of Cul-3-Dbo/Kel. (A-D) dshV26 FRT19A/FRT19A; ptc-GAL4/+; Ubc12IR-7375R-3, Ubx-FLP/+ (A), dshV26 FRT19A/Ubx-FLP FRT19A; ptc-GAL4/Cul-3IR-109415 (B), dshV26 FRT19A/Ubx-FLP FRT19A; kelDE1 FRT40/arm-lacZ FRT40 (C) and dshV26 FRT19A/Ubx-FLP FRT19A; ptc-GAL4/+; fafIR-2956/+ (D). Wings are stained for Stbm (green), Dsh (red) and β-gal (blue, C); yellow bars mark the ptc-GAL4 domain. Compare Stbm levels in the same wing in the presence or absence of dsh activity. (A,B) Stbm no longer accumulates in dsh clones. (C) In dsh; kel double-mutant tissue (arrow), Stbm no longer accumulates compared with kel mutant tissue (loss of blue), and levels are similar to those upon loss of dsh alone (arrowhead). (D) The dsh clone crosses the ptc-GAL4 boundary, and where fafIR is expressed (above the arrow) Stbm levels are decreased. Scale bar: 20 μm. (E-G) Western blots showing pulldown of Myc-tagged Dbo and Kelch by GFP-tagged Dsh in S2 cells (E,G) and COS-7 cells (F). Loading of input is 1% of pulldown. Molecular mass (kDa) is shown to the left.

