
Figure 3.
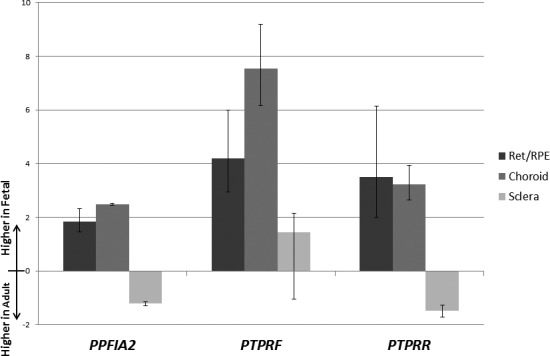
Fetal versus adult fold changes of real-time quantitative PCR validated genes. The columns from left to right (and darkest to lightest) for each gene represent the retina/RPE, choroid, and sclera. Fold changes were calculated by the 2−ΔΔCT method. Biological variation is shown by error bars for each tissue/gene.