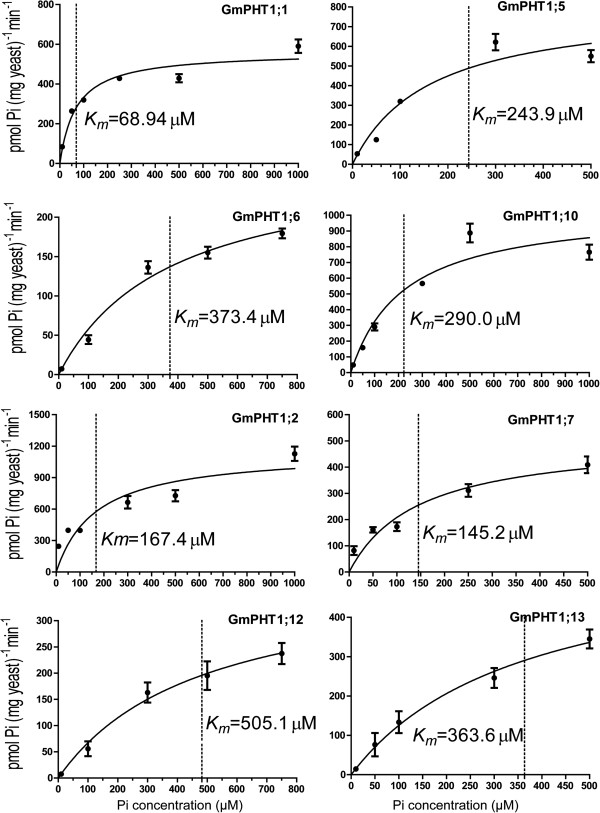
Figure 7.
Radioactive phosphorus (32Pi) uptake by PAM2 cells carrying aGmPHT1 gene. Each point represents the average and SD of at least three uptake experiments. The concentration of external Pi was 10 μM, 50 μM, 100 μM, 300 μM, 500 μM or 1000 μM. Km values are indicated next to the dot lines and gained through GraphPad Prism 5.

