
Figure 1.
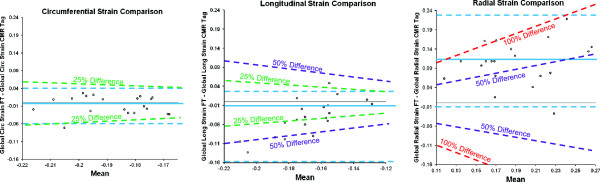
Modified Bland Altman plots showing comparisons between Feature Tracking and CMR tagging for global strain parameters: Circumferential strain (left); longitudinal strain (middle); radial strain (right). The bias (blue solid line) and limits of agreement (blue dashed lines) are shown. The oblique dashed lines demonstrate 25 (green), 50 (purple) and 100% (red) difference levels.