Figure 11.

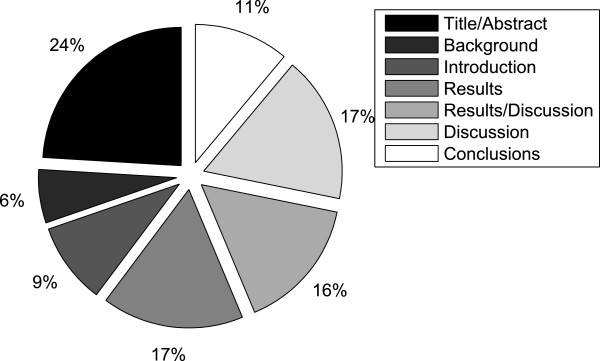
Causality per discourse zone. Distribution of causal associations in the corpus amongst seven different discourse zones relative to the number of tokens in each zone.

Causality per discourse zone. Distribution of causal associations in the corpus amongst seven different discourse zones relative to the number of tokens in each zone.