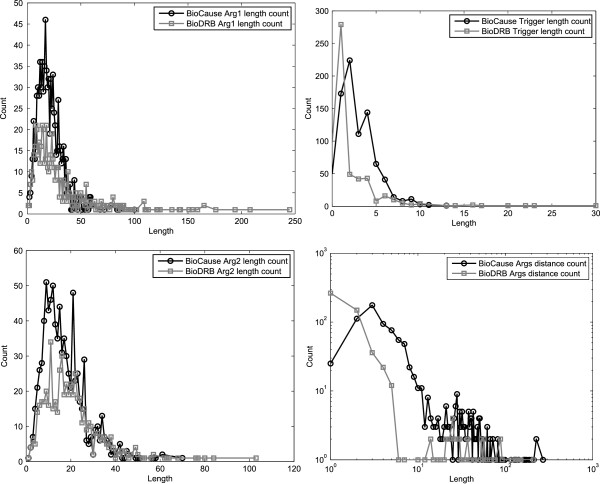
Figure 15.
Comparison between BioCause and BioDRB. Comparison of the distributions of trigger lengths, first argument lengths, second argument lengths and distance between arguments between the BioCause and BioDRB corpora. The distance between arguments is given using a logarithmic scale in order to provide a better view.

