Fig. 12.

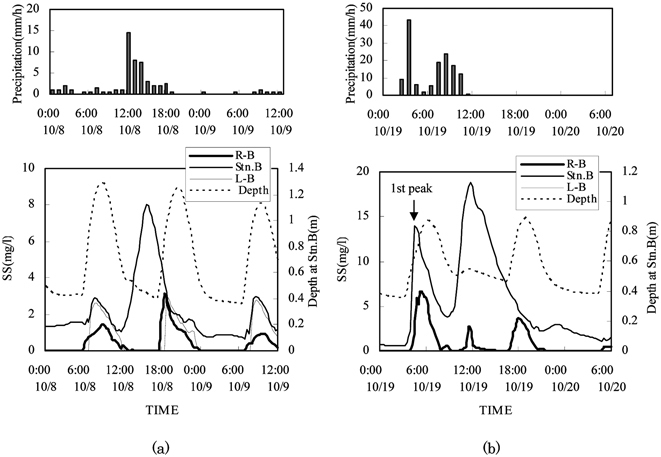
Calculated temporal variation of suspended solids during floods in Oct. 2000 (a) Flood occurred during low tide, (b) The 1st peak of flood occurred at high tide for which the sediment concentration at R-B is large.

Calculated temporal variation of suspended solids during floods in Oct. 2000 (a) Flood occurred during low tide, (b) The 1st peak of flood occurred at high tide for which the sediment concentration at R-B is large.