Fig. 8.

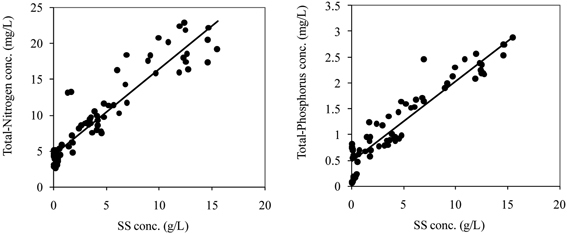
Relations between suspended sediment concentration (SS) and those of nutrients. Solid lines show the empirical regressions.

Relations between suspended sediment concentration (SS) and those of nutrients. Solid lines show the empirical regressions.