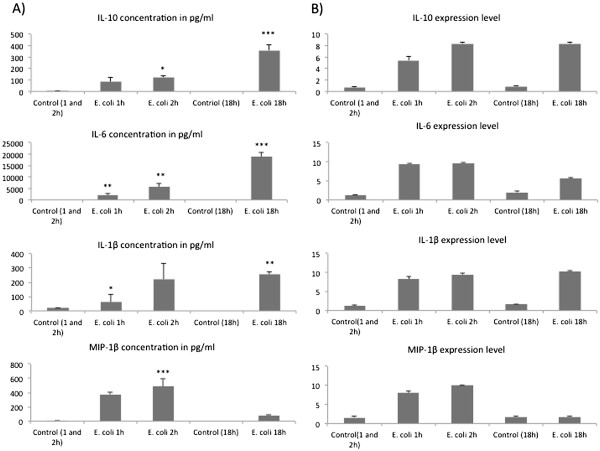
Figure 6.
Peritoneal fluid cytokine concentrations and corresponding gene expression determined by microarrays.A) Cytokine concentrations measured by bioplex (n = 5) from the peritoneal fluid of control and naive and infected mice after 1, 2 and 18 h of intraperitoneal inoculation of 2X10⁸ cells of E. coli ***P < 0.001, **P < 0.01, *P < 0.05. (B) Corresponding gene expression determined by microarrays in significant differentially expressed genes.

