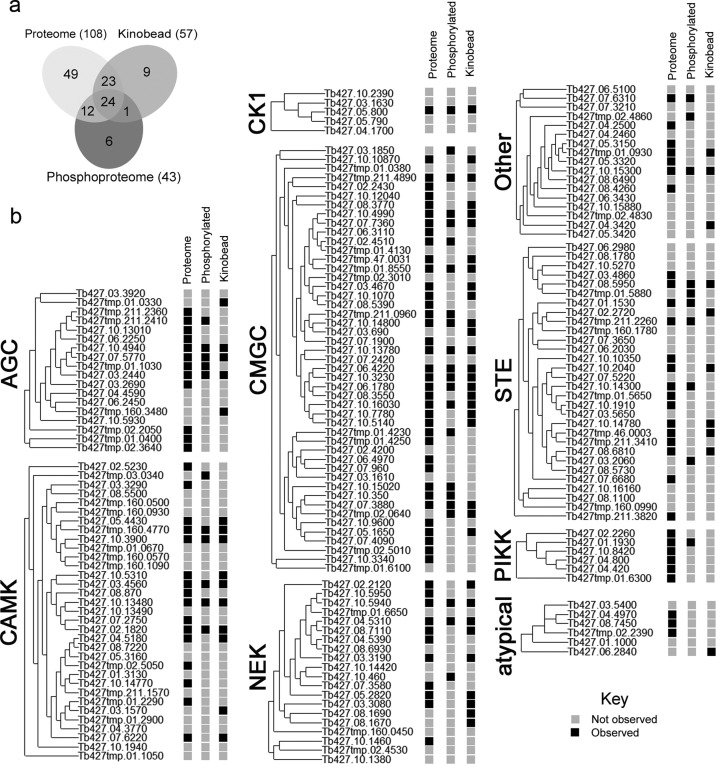
Figure 2.
Profiling the kinome expressed in bloodstream form T. brucei using complementary mass spectrometry-based observations. (a) Venn diagram summarizing overlapping protein kinase observations. (b) Details of protein kinases observed (black square), divided by kinase group classification according to the similarity of their catalytic domains. Proteome: detection at natural abundance. Phosphorylated: enrichment of phosphorylated peptides.5 Kinobeads: enriched by immobilized mixed kinase-inhibitors.

