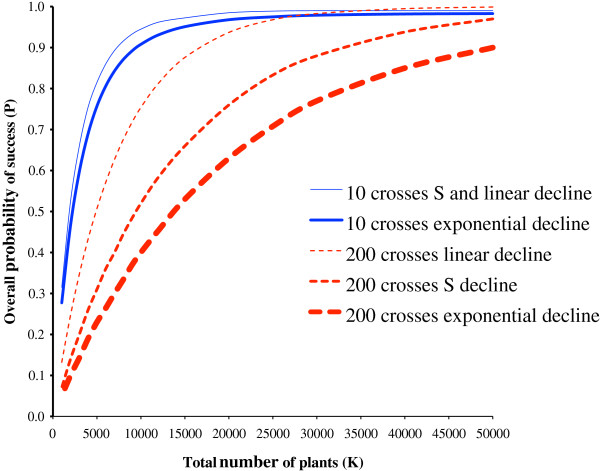
Figure 1.
The overall probability of a programme succeeding when P1 declines with cross number. A comparison of either 10 or 200 crosses with K varying from 1,000 to 50,000 and with the probability of plant succeeding within a cross constant at 0.001. The probability of an individual cross succeeding is initially 0.4 and declines to 0.005 in an S-shape (S), or linearly (L), or exponentially (E) (the exact shapes are shown in Figure 3). Using 10 crosses with an S-shape or a linear decline give practically identical results, so only the mean of the two is shown.

