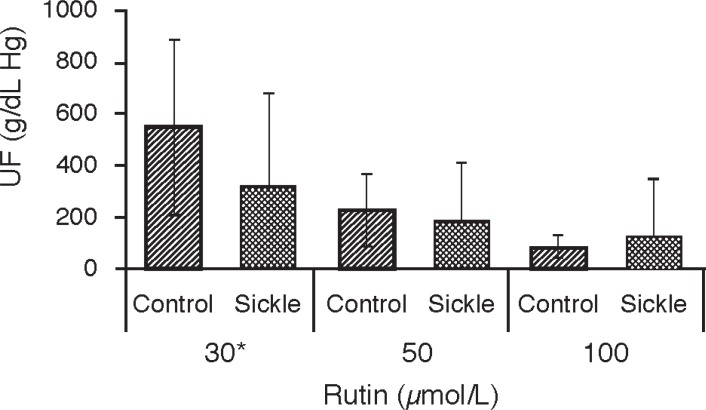
Figure 3.
Reactive oxygen species production in erythrocytes from normal and sickle cell anemia patients under the pro-oxidant action of tert-butylhydroperoxide after incubation with rutin
*Statistically significant difference on comparing 50 vs. 100 µmol/L rutin (Kruskal-Wallis; p-value = 0000)
Error bar represents standard deviation
Average of four independent determinations
75 µmol/L t-BHP was added after incubation with the flavonoid

