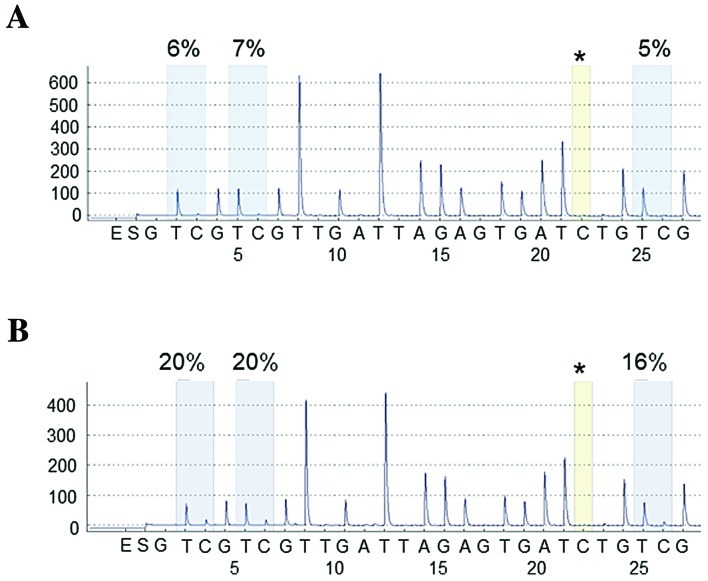
Figure 1.
Measurement of the SLIT2 methylation level using pyrosequencing. (A) SLIT2 unmethylated non-malignant lung tissue (methylation level, 6%). (B) SLIT2 methylated tumor (methylation level, 18.7%). The percentages are the proportion of C at each CpG site after bisulfite conversion, and the methylation level of each CpG site is estimated by the proportion of C (%). An overall SLIT2 methylation level is calculated as the average of the proportion of C (%) at the 3 CpG sites. The asterisks indicate no residual C at the non-CpG site, ensuring complete bisulfite conversion.

