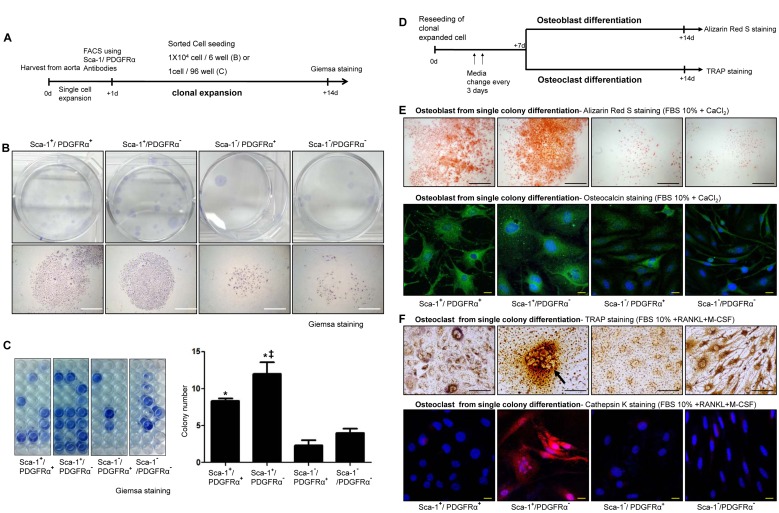
Figure 2. Clonal expansion of calcifying progenitor cells.
(A) Schematic of the clonal expansion assay. (B) Giemsa staining to detect a single-cell colony. Bars: 1 mm. (C) For statistical analysis, colony-forming cells were counted among 96 wells per group. Experiments were performed in triplicate. Colonies formed by Sca-1+ cells were much more compact and abundant than Sca-1− cells. *P<0.001 versus Sca-1−/PDGFRα+ cells. ‡P<0.005 versus Sca-1+/PDGFRα+ cells. (D) Schematic depicting osteoblastic and osteoclastic differentiation of clonally expanded cells. (E) Alizarin Red S and osteocalcin staining to detect osteoblast differentiation from single-colony cells after 14 d of differentiation. Bars: black = 1 mm; white = 20 µm. (F) TRAP and cathepsin K staining to detect osteoclast differentiation from single-colony cells after 14 d of differentiation. Bars: black = 100 µm; white = 20 µm.

