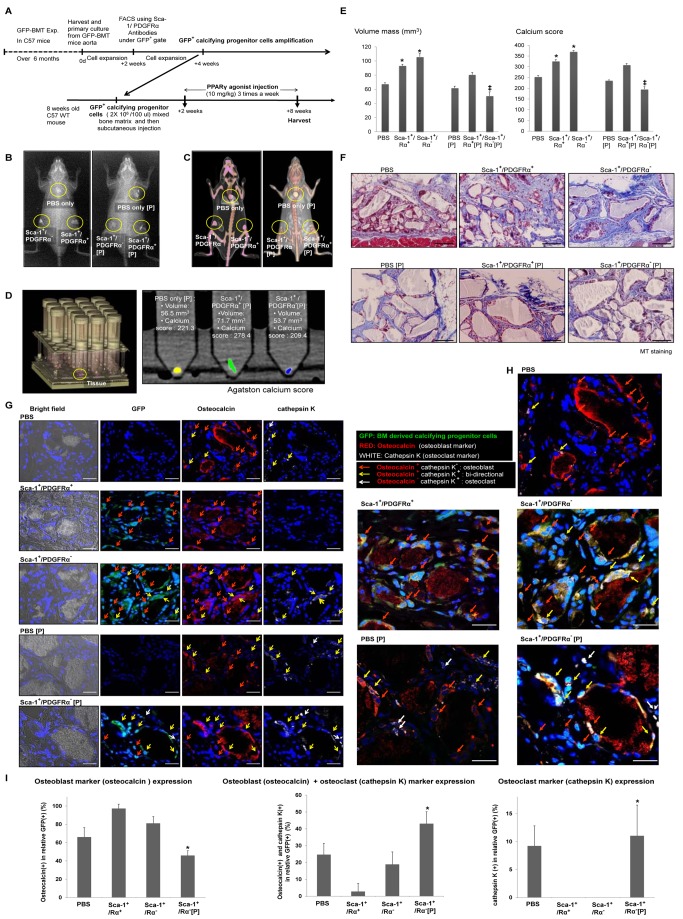
Figure 6. Calcifying progenitor cells in an in vivo bone-like structure matrix calcification model.
(A) Timeline of the calcification model (n = 10 per group). (B) X-ray and (C) CT of GFP+Sca-1+ cells mixed with bone matrix and implanted subcutaneously into C57 mice. (D) Quantification of CT results using Agatston scoring. (E) Volume mass and calcium scores of mice injected with GFP+Sca-1+ cells with or without concurrent PPARγ agonist treatment. *P<0.005 versus PBS-treated mice. ‡P<0.001 versus mice injected with GFP+Sca-1+/PDGFRα− cells. (F) MT staining. Bars: 100 µm. (G) Immunostaining with osteocalcin, an osteoblastic marker, and cathepsin K, an osteoclastic marker, to determine the differentiation fate and the effect of PPARγ activation on injected Sca-1+ cells. Bars: 20 µm. (H) Enlarged immunostaining images showing osteocalcin and cathepsin K. Bars: 20 µm. (I) Osteoblastic, osteoclastic, and bidirectional cell counts. GFP+Sca-1+/PDGFRα+ cells primarily expressed osteoblast markers. Most of the GFP+Sca-1+/PDGFRα− cells differentiated into osteoblast-like cells, but some cells differentiated into bidirectional cells. When PPARγ was activated, GFP+Sca-1+/PDGFRα− cells differentiated more frequently into bidirectional cells or osteoclasts (n = 10 per group). *P<0.005 compared to mice injected with GFP+Sca-1+/PDGFRα− cells. P, PPARγ agonist.

