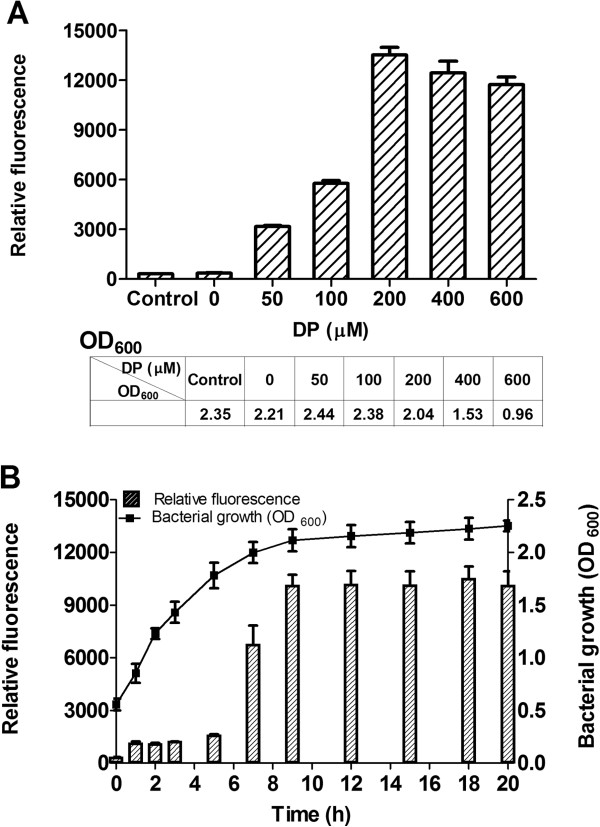
Figure 3.
PfhuA1-controlled GFP expression induced by 2,2’-dipyridyl. A. GFP expression levels of E. coli Top10/ptPfhuA1 under the induction of different 2,2’-dipyridyl concentrations. OD600 in the table represented the OD600 value of cultures at 20 h post-induction. B. Time course analysis of GFP expression in E. coli Top10/ptPfhuA1 after induction with 200 μM 2,2’-dipyridyl. 2,2’-dipyridyl was added at 0 h. The error bars represent the standard deviation (SD) for one independent experiment, performed in triplicate, the experiment was repeated for three times.

