
Figure 4. Binding and colocalization of NRIF3 with ERα.
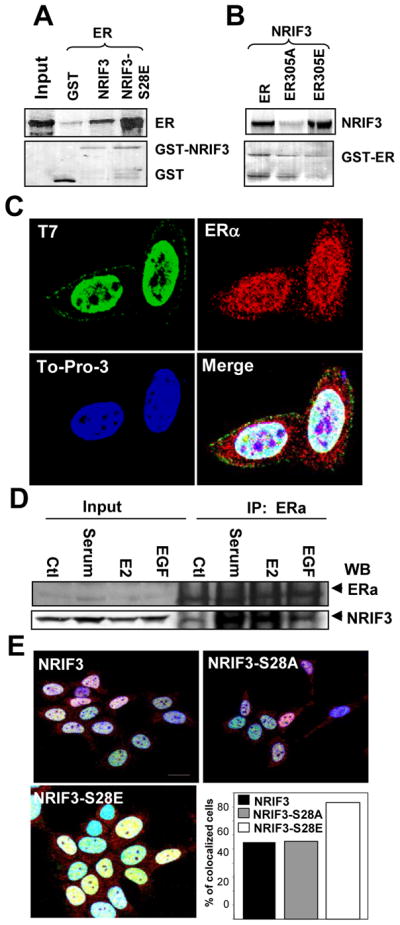
(a–b)GST-pull down assay was carried out either with GST, GST-NRIF3 or GST-NRIF3-S28E with 35S ERα (a) and GST-ERs with 35S NRIF3 (b). Upper panels are the autoradiogram showing bound ERα (a) and bound NRIF3 (b). Lower panels are ponceau-S staining of the blots showing the amount of protein transferred to the blots. (c) Immunofluorescent localization of transfected T7-NRIF3 (green) and endogenous ERα (red) in MCF-7 cells grown in regular medium for 24 h. Blue, DNA dye TO-PRO-3; yellow indicates colocalization of green and red fluorescence. Bar=10 μm. (d) NRIF3 binds with ERα in vivo. MCF-7 cells were treated with 10% serum, E2, or EGF and IP with ERα antibody. Western blots analysis was performed with ERα or with NRIF3 antibody. (e) Colocalization of NRIF3 and ERα is affected by ser28 of NRIF3. Cells were grown in DCC medium for 48 h. Blue, DNA dye TO-PRO-3; yellow, colocalization of green and red fluorescence. For quantification, cells demonstrating nuclear colocalization (yellow) of transfected NRIF3 (green) and endogenous ERα (red) were counted in at least 150 cells per treatment group and graphed as a percentage of the total cells counted. Bar=10 μm.