Figure 1.
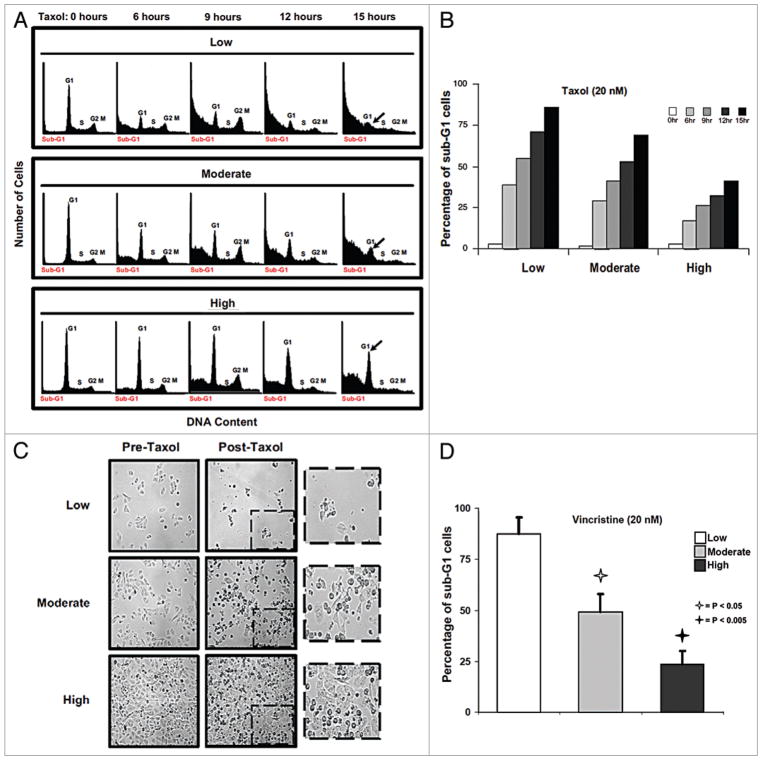
Cell growth density determines proportion of SKBR3 cells that are rapidly killed by paclitaxel and vincristine. (A) Cell death after Taxol of cells grown at three different densities. Parallel plates of SKBR3 cells were grown at the respective densities, and then harvested prior to treatment (“0 hours”) or at the indicated times after treatment with paclitaxel (“Taxol”, 20 nM) for cell cycle analysis via FACS. Low density = 10–30% confluency. Moderate density = 50–70% confluency. High density = 80–100% confluency. Histograms show cell cycle distribution, with the respective phases indicated. By 15 h after treatment, virtually none of the cells grown at low density were still alive, while a substantial proportion of cells grown at high density were viable. The arrow indicates cells in G1 that remain viable and intact, especially prominent in the cells grown under dense conditions. (B) Bar graphs showing the percentage of nonviable cells with sub-G1 DNA content in each of the FACS histograms shown in (A). The bars represent the respective times after the addition of paclitaxel according to the figure legend. (C) SKBR3 cells grown at the three different densities as described in (A), were imaged (x40) before or 12 h after treatment with paclitaxel (Taxol). The area within the dashed box is shown at higher magnification. (D) SKBR3 cells growing at the three densities were prepared as in (A), but treated with vincristine (20 nM) for 15 h. All cells were then harvested for cell cycle analysis via FACS. Bar graphs show the percentages of treated cells at each growth density (indicated in the figure legend) undergoing nuclear fragmentation and resulting in sub-G1 DNA accumulation. Error bars represent standard deviation. Open and filled stars indicate significant differences between the low density and the moderate and high density treatment groups, respectively, with associated p values.

