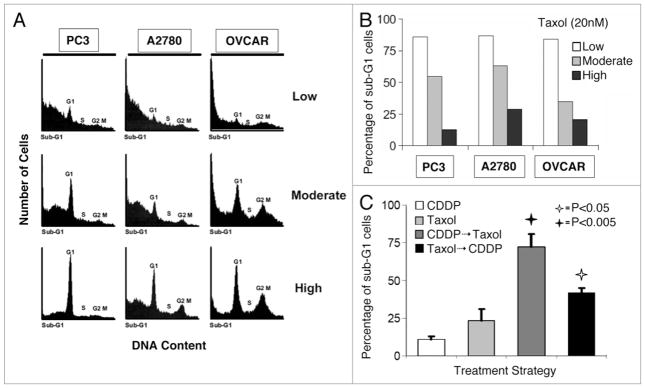
Figure 3.

Cell lines susceptible to rapid killing by paclitaxel are rendered more resistant when grown at a high growth density and resistance is abrogated when cells are pretreated with cisplatin. (A) PC3, A2780 and OVCAR-3 cells were grown under the three different cell growth densities as described previously for SKBR3 cells (Fig. 1), treated with paclitaxel (“Taxol”, 20 nM), and were harvested 15 h later for cell cycle analysis via FACS. (B) Bar graphs showing the percentage of cells of each cell line and of each growth density undergoing nuclear fragmentation, resulting in sub-G1 DNA content, after treatment with paclitaxel. Low density = 10–30% confluency. Moderate density = 50–70% confluency. High density = 80–100% confluency, according to figure legend. (C) The resistance to rapid killing by paclitaxel of cancer cells growing at high density is abrogated when cells are pretreated with cisplatin. SKBR3 cells were grown at high density, and treated with cisplatin (5 μg/ml) for 12 h, paclitaxel (20 mM) for 12 h, cisplatin for 6 h followed by paclitaxel for 6 h, or paclitaxel for 6 h followed by cisplatin for 6 h. All cells were then harvested for cell cycle analysis via FACS. Bar graphs show the percentages of treated cells at each growth density undergoing nuclear fragmentation, resulting in sub-G1 DNA content. The experiment was repeated three times. Error bars represent standard deviation. Open and filled stars indicate significant differences between the following treatment strategies: Taxol vs. Taxol → CDDP and CDDP vs. CDDP → Taxol, respectively, with associated p values.
