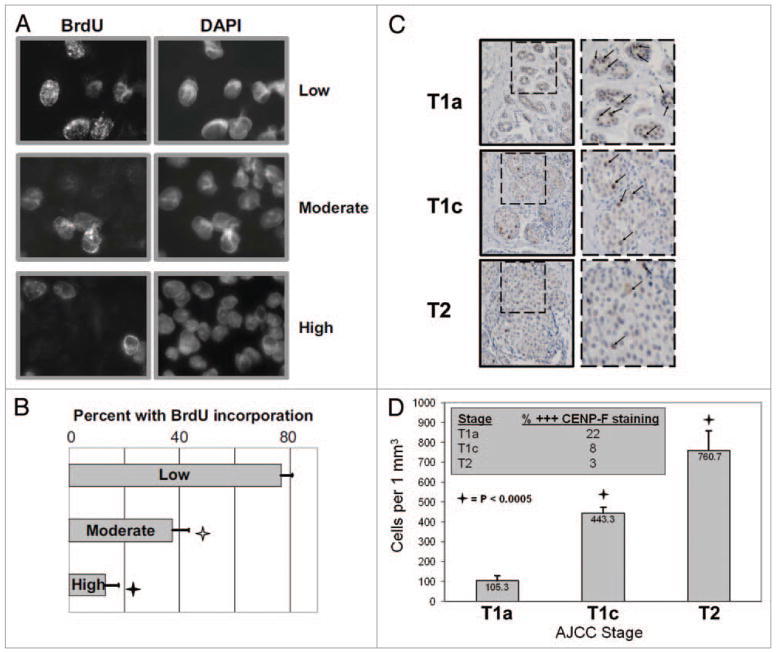
Figure 4.
The proportion of actively replicating cells is inversely proportional to cell growth density, in vitro as well as in vivo. (A) SKBR3 cells were grown on coverslips at the at the three different cell growth densities, pulse-labeled with BrdU for 10 min, and then fixed and probed for BrdU and total chromatin via DAPI. The proportion of cells showing BrdU uptake indicative of active replication as a function of total cells was counted. Representative images of cells grown at each growth density staining for BrdU and total chromatin (DAPI). (B) Bar graphs showing the percentages of cells of each growth density that are actively replicating. Each data point and its standard deviation (error bars) represents the results from at least three different plates of cells. The experiment was repeated three times, with similar results. Open and filled stars indicate significant differences between the low density and the moderate and high density treatment groups, respectively, with associated p values. (C) Breast cancer cell growth density correlates with increasing tumor stage. Excisional biopsies from three representative patients presenting with AJCC Stages T1a (background of DCIS with microinvasion), T1c, and T2 breast cancer were fixed onto slides. These were subsequently deparaffinized and probed for CENP-F (specific marker of G2/M cells) and counterstained with hematoxylin. Representative image of 1 mm2 of tissue from each patient is shown. The area within the dashed box is shown adjacent at a higher magnification. Tumor cells show abundant cytoplasm, and those in G2/M show high expression of CENP-F (individual CENP-F expressing cells indicated by arrows in images at higher magnification). (D) Bar graphs showing the average number of cells per 1 mm2 areas of tumor tissue. Each data point and its standard deviation (error bars) represents the results from at least three samples. Five separate areas were counted. Stars indicate significant differences between the T1a samples and the T1c and T2 samples with associated lc value. Figure inset: average percentage of tumor cells of each mm2 area strongly expressing CENP-F (% +++ CENP-F staining) according to Stage (T1a, T1c and T2).

