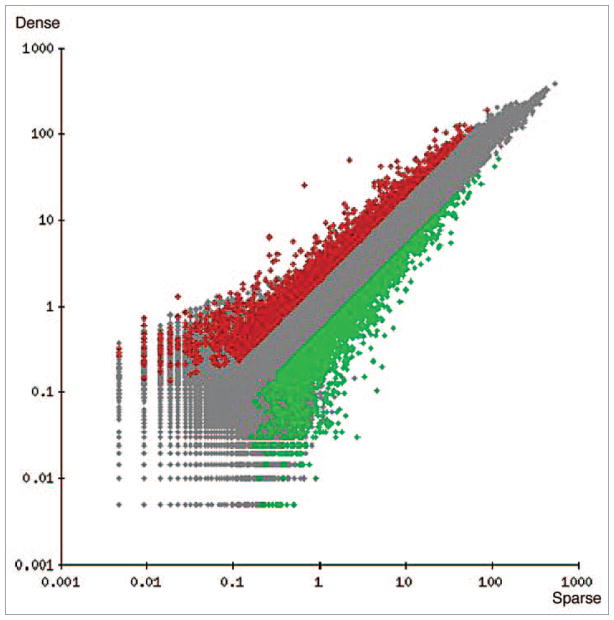
Figure 5.
Scatter plot of 38,500 genes derived from microarray analysis of cells grown at low (sparse) or high (Dense) density. Data was filtered from a raw data set of 38,500 genes. Five thousand, two hundred and nine differentially expressed genes were identified that met the filtering criteria. Genes that did not pass the filtering criteria are displayed in light gray. Genes that passed filtering criteria (5209 genes) are shown in black as upregulated (≥2-fold expression increase), or in dark gray as down-regulated (≥2-fold expression decrease).

