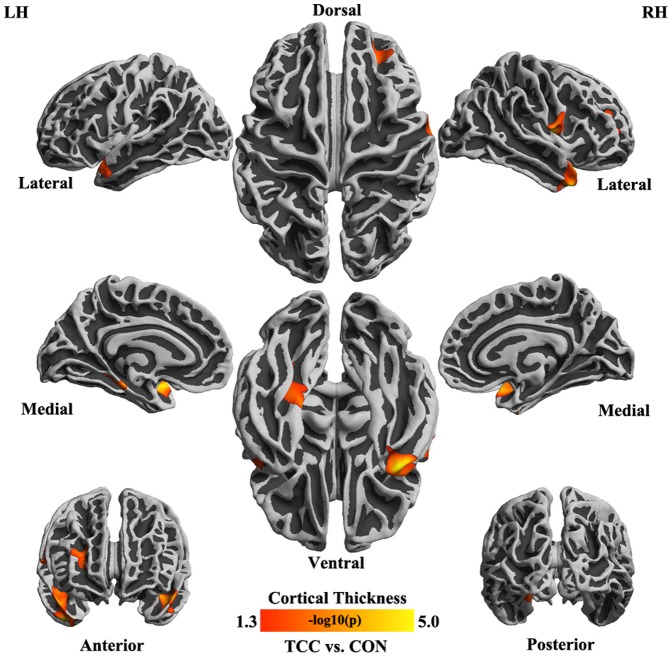
Figure 3. Cortical regions thicker in TCC practitioners than in controls.
Statistical map depicting between-group differences in thickness at each point on the cortical surface overlaid on the inflated average brain. All points meeting a p<0.05 (corrected) threshold are displayed to better illustrate the anatomic extent of the areas and relative specificity of the findings.

