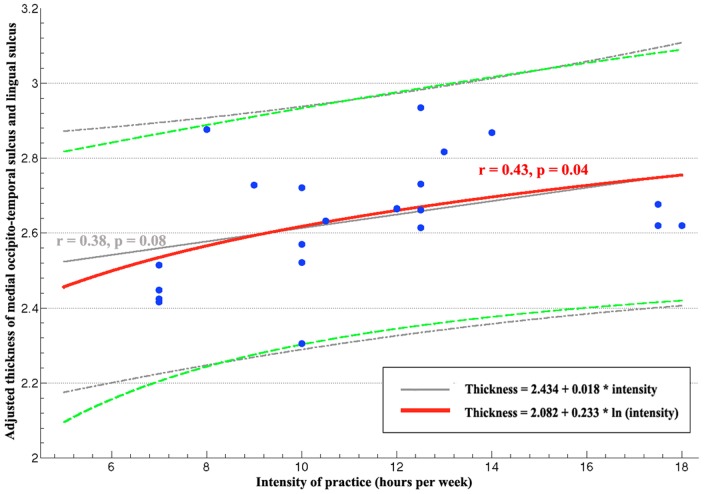
Figure 4. Scatter plot of cortical thickness in TCC group.
The red line represented the correlation between logarithm transformed intensity and cortical thickness (adjusted by sex, age, education and ICV) in left medial occipito-temporal sulcus and lingual sulcus. The green dotted lines indicated its 95% confidence intervals. The linear correlation between intensity and the cortical thickness in this region are displayed in grey line with its confidence intervals as dotted.

