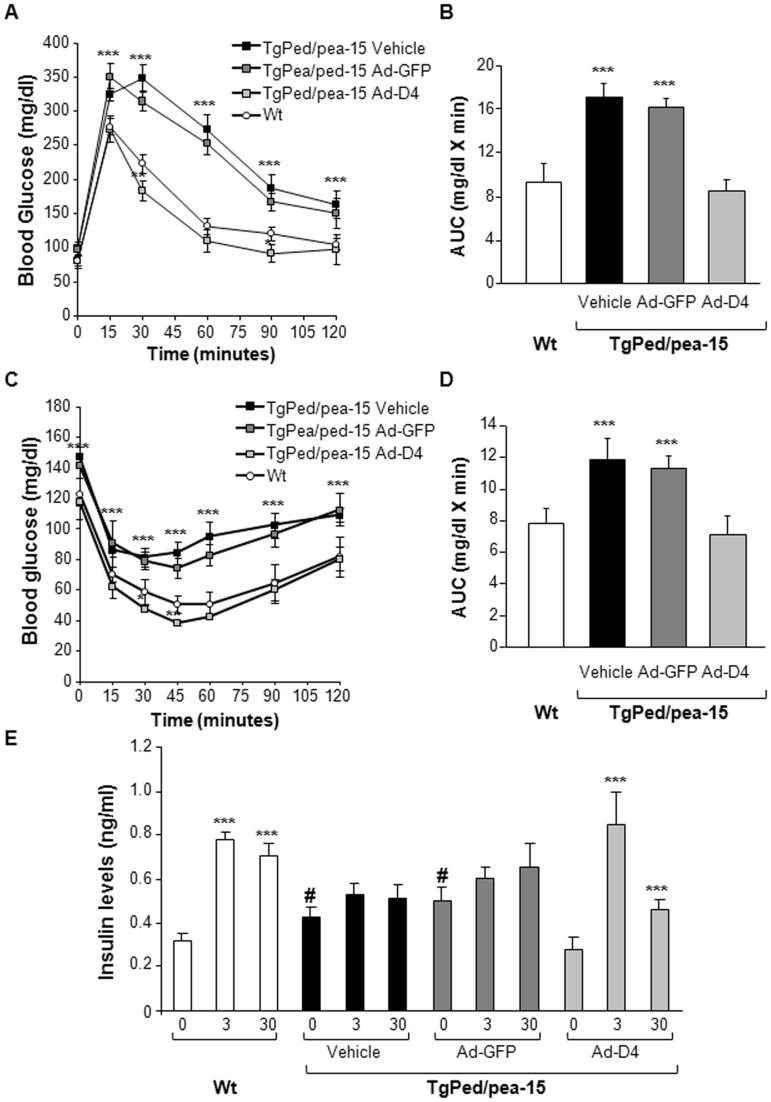
Figure 2. Glucose tolerance, insulin sensitivity and insulin secretion in TgPed/pea-15 mice.
A) Glucose Tolerance Test (GTT) and (B) Area Under the Curve (AUC) glucose in TgPed/pea-15 mice treated with vehicle (black square and column) or after infection with Ad-GFP (dark grey square and column) or with Ad-D4 (light grey square and column), and wild type mice (Wt, white circle and column) used as controls. C) Insulin Tolerance Test (ITT) and (D) Area Under the Curve (AUC) glucose in TgPed/pea-15 mice treated with vehicle (black square and column) or after infection with Ad-GFP (dark grey square and column) or with Ad-D4 (light grey square and column), and wild type mice (Wt, white circle and column) used as controls. For each experiment, values are expressed as means ± SEM of determinations in at least eight mice per group. ***p<0.001 vs Wt. E) Glucose-induced insulin secretion in 6 TgPed/pea-15 mice treated with vehicle (black square and column) or after infection with Ad-GFP (dark grey square and column) or with Ad-D4 (light grey square and column), and wild type mice (Wt, white circle and column). Data points represent the means ± SEM of determinations in five mice per group. ***p<0.001, t = 3 and t = 30 vs t = 0; #p<0.001, TgPed/Pea-15 t = 0 vs Wt t = 0.

