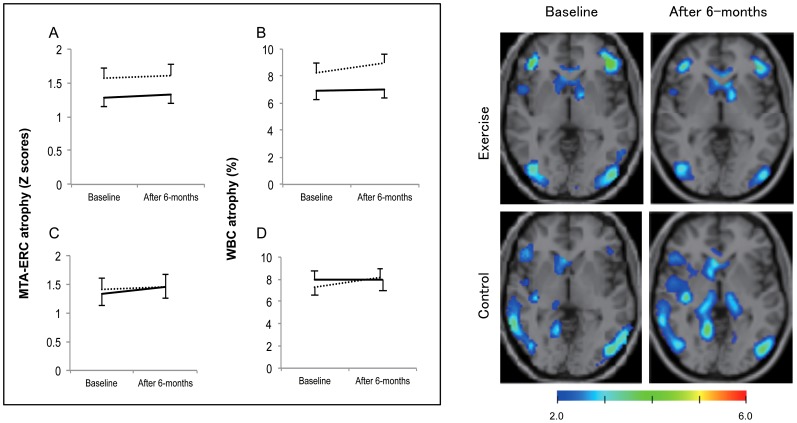
Figure 2. Change in MTA-ERC and WBC volumes in response to the 6-month intervention.
Abbreviations: MTA-ERC, medial temporal areas including the entorhinal cortex; WBC, whole brain cortices. Left panel shows change in MTA-ERC and WBC volumes before and after the 6-month intervention. Solid and dashed lines indicate the exercise and control groups, respectively. Group mean differences and standard errors for MTA-ERC and WBC atrophy are shown in panels A and B, respectively, for all subjects. Panels C and D show mean differences and standard errors for MTA-ERC and WBC atrophy, respectively, for older adults with aMCI. The repeated-measures ANOVA revealed that there was a significant group × time interaction on WBC atrophy level (p<.05) in older adults with aMCI. Right panel shows typical images for VSRAD, indicated atrophy region, in subjects with aMCI in the exercise and control groups. The upper panel shows WBC atrophy in a man (81 years old) with aMCI who completed the 6-month exercise program. The rate of WBC atrophy decreased after the intervention (8.74% at baseline to 6.39% after the intervention). The lower panel shows WBC atrophy of a man (80 years old) with aMCI in the control group. The rate of WBC atrophy increased after the 6-month intervention period (7.19% at baseline to 10.48% after the intervention).

