
Figure 1.
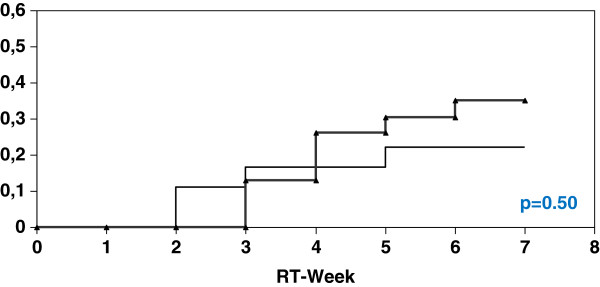
Univariate analysis (log-rank) for the incidence of at least diarrhoea CTC 2 depending on PTV <= 1302 ml (thick curve: without Se; thin curve: with Se).
Official websites use .gov
A
.gov website belongs to an official
government organization in the United States.
Secure .gov websites use HTTPS
A lock (
) or https:// means you've safely
connected to the .gov website. Share sensitive
information only on official, secure websites.
Univariate analysis (log-rank) for the incidence of at least diarrhoea CTC 2 depending on PTV <= 1302 ml (thick curve: without Se; thin curve: with Se).