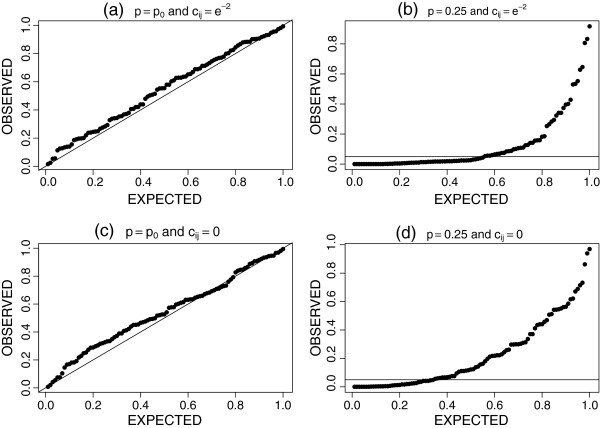
Figure 1.
One-sample tests for an Erdős-Rényi graph. P-value results from 100 independent tests of H0:G(25,p) = G(25,0.20) versus H1:G(25,p) > G(25,0.20). The y-axis is the observed resample p-value; the x-axis is the expected p-value under the null hypothesis. Panels (a) and (c), via a uniform distribution qq-plot, illustrate the Type I error rate using 2 settings for cij. Panels (b) and (d) illustrate the performance of D under the alternate hypothesis for 2 settings of cij; a horizontal line corresponding to an α = 0.05 level is provided.

