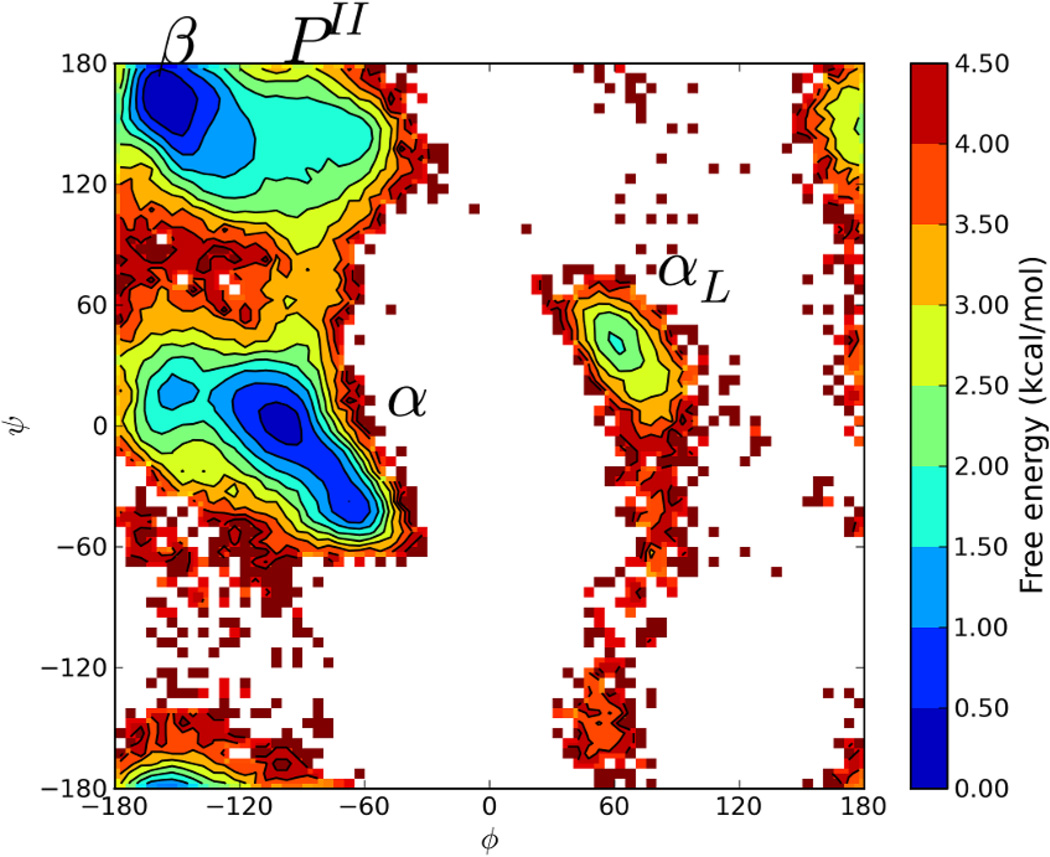
Figure 3.
Ramachandran Free Energy Profile for the central Alanine residue from CSA-nbR-REM simulations with 64 reservoir conformations at 300K. The simulations were repeated with the newly generated reservoir containing no D- and cis-peptides. An almost identical free energy landscape as standard T-REM simulations were observed, however the αL region has around 1 kcal/mol lower free energy.

